EpiTrace.AI
Platform v9.4.3

One place for single-cell methylation analysis

EpiTrace.AI combines loading, mapping, lineage views, marker search and export in one web application. Researchers work in the browser; ETHORITY runs the infrastructure.

7modules in one application
.h5ad · CSVdata formats in
100,000+cells in the viewer
CSV · PNG · SVGformats out
The modules in detail

Seven modules from raw data to markers you can check

Each module covers one step of the analysis. Hover information, colours and filters stay consistent across the views.

01 / 07

Loader

What is in my data?

Load single-cell methylation data as .h5ad (AnnData) or CSV. The overview shows cells, CpG sites and annotations such as cell type, lineage and time point.

  • Upload .h5ad or CSV, or start with the demo data set
  • Instant summary of cells, CpG sites and annotations
  • Preview by cell type, lineage, stage, tissue, donor and time point
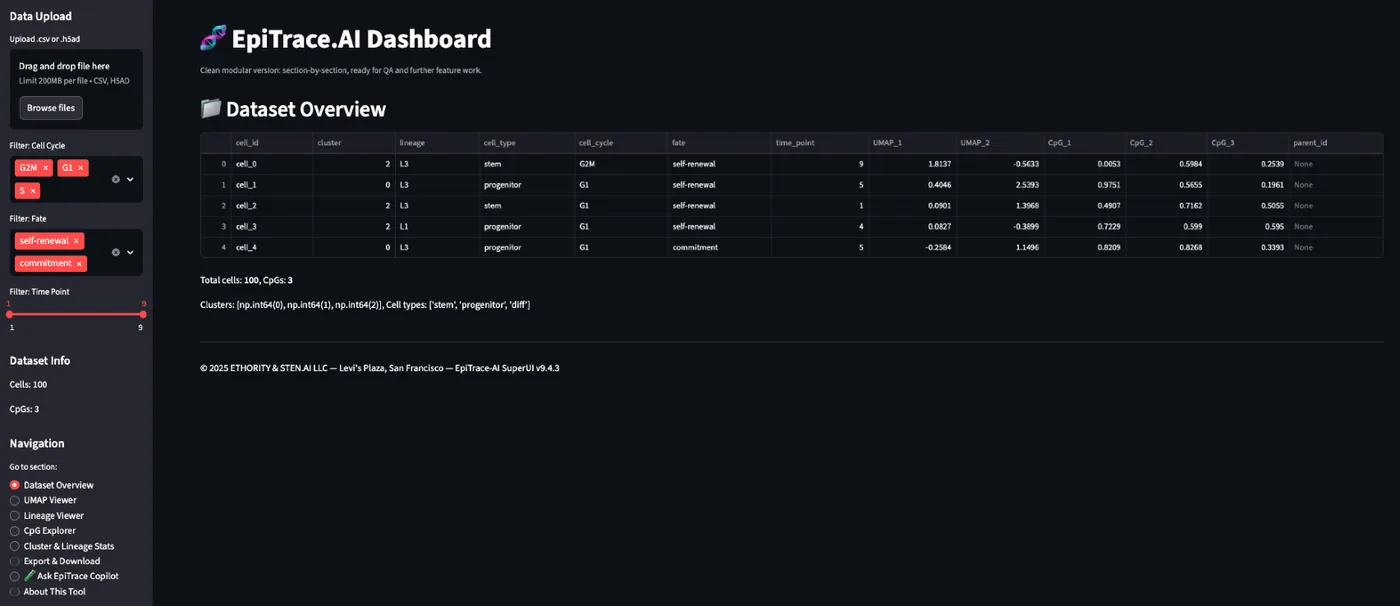
Dataset overview: Screenshot · platform v9.4.3 · synthetic demo data
Screenshot · platform v9.4.3 · synthetic demo data
02 / 07

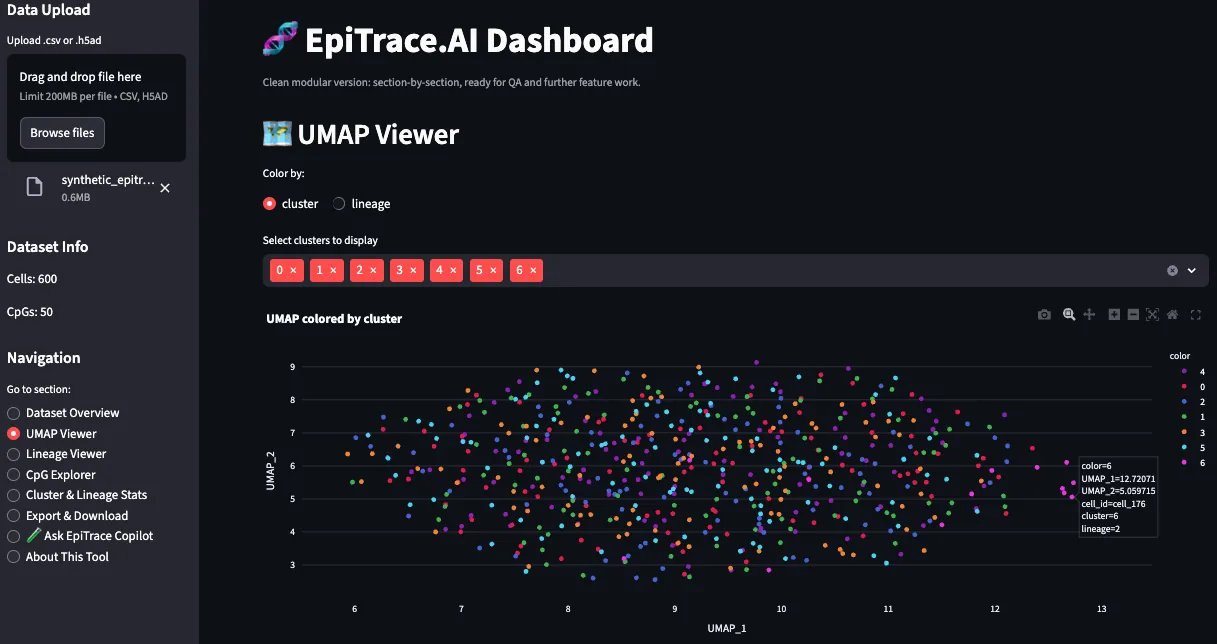
UMAP map

Which cells are alike?

UMAP draws a map on which cells with similar methylation sit close together. Colour it by cluster, lineage, cell type or time point.

  • Colour by cluster, lineage, cell type or time point
  • Hover shows the metadata of each cell
  • Colours stay in sync with the lineage viewer
UMAP viewer: Screenshot · platform v9.4.3 · synthetic demo data
Screenshot · platform v9.4.3 · synthetic demo data
03 / 07

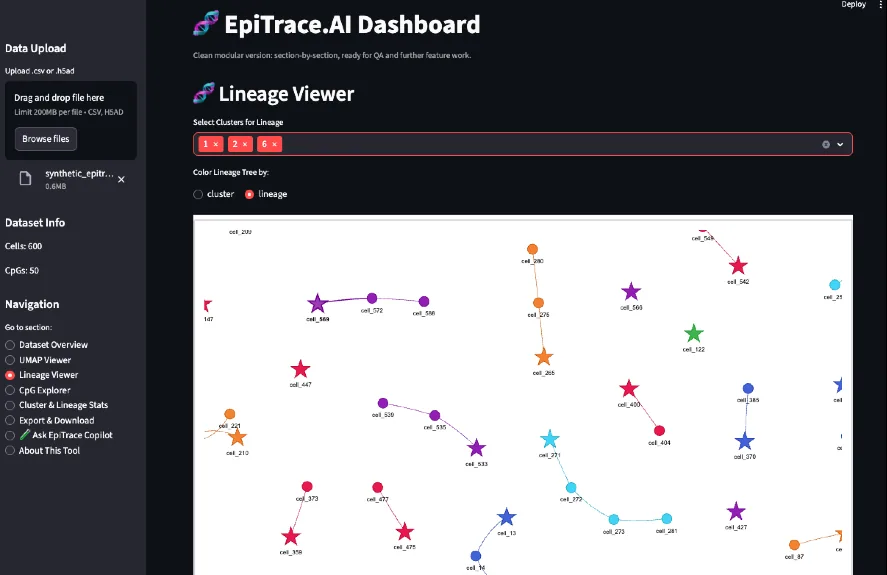
Lineage viewer

How do lineages unfold?

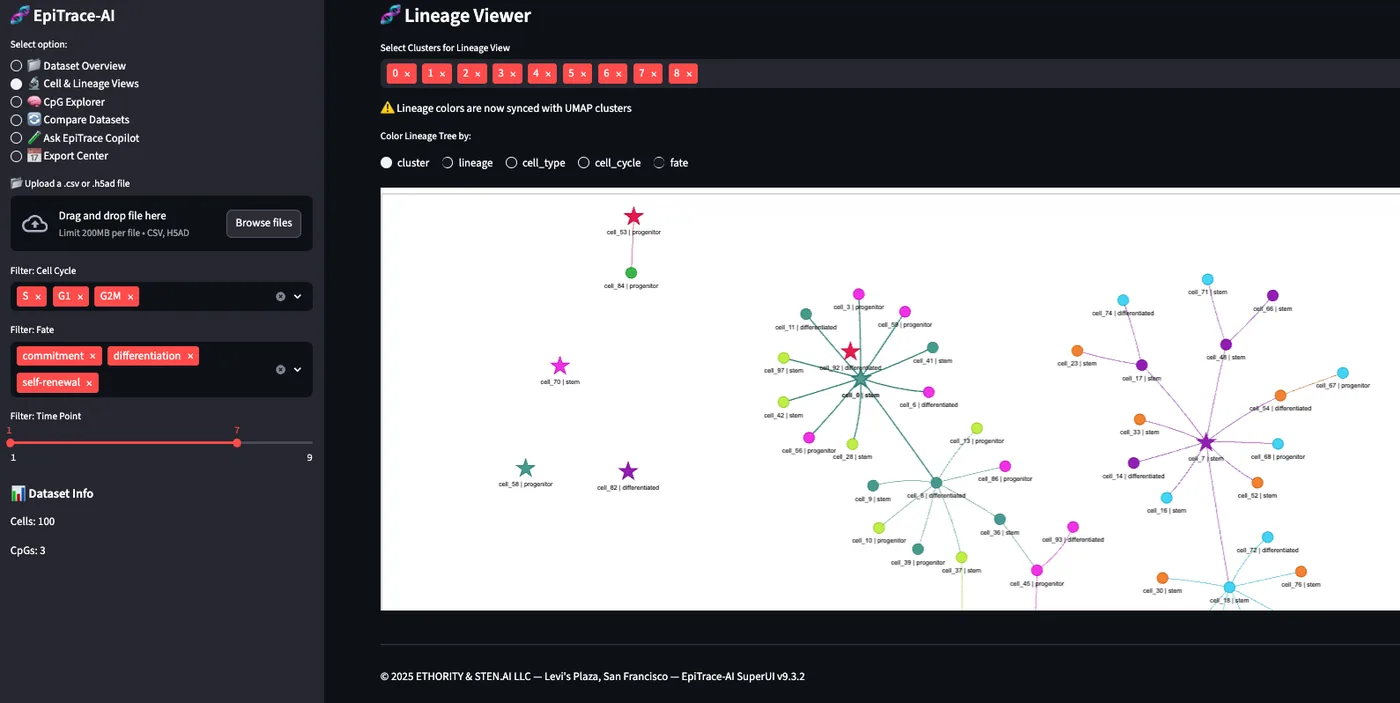
The lineage viewer draws the cells of each lineage as a connected network, in step with the UMAP map. Filter by lineage, donor, time point or stage and follow a lineage across time.

  • Filter by lineage, donor, time point and stage
  • Zoom and pan through large networks
  • Hover shows the metadata of each cell
Lineage viewer: Screenshot · platform v9.4.3 · synthetic demo data
Screenshot · platform v9.4.3 · synthetic demo data
04 / 07

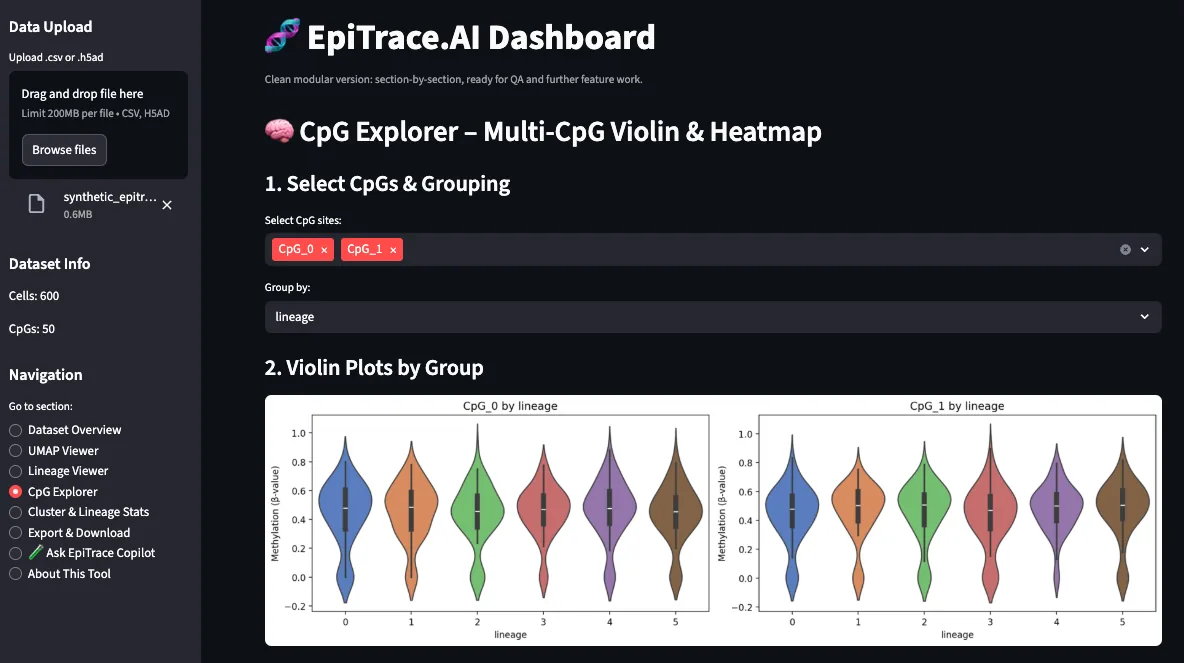
CpG explorer

Which sites differ between groups?

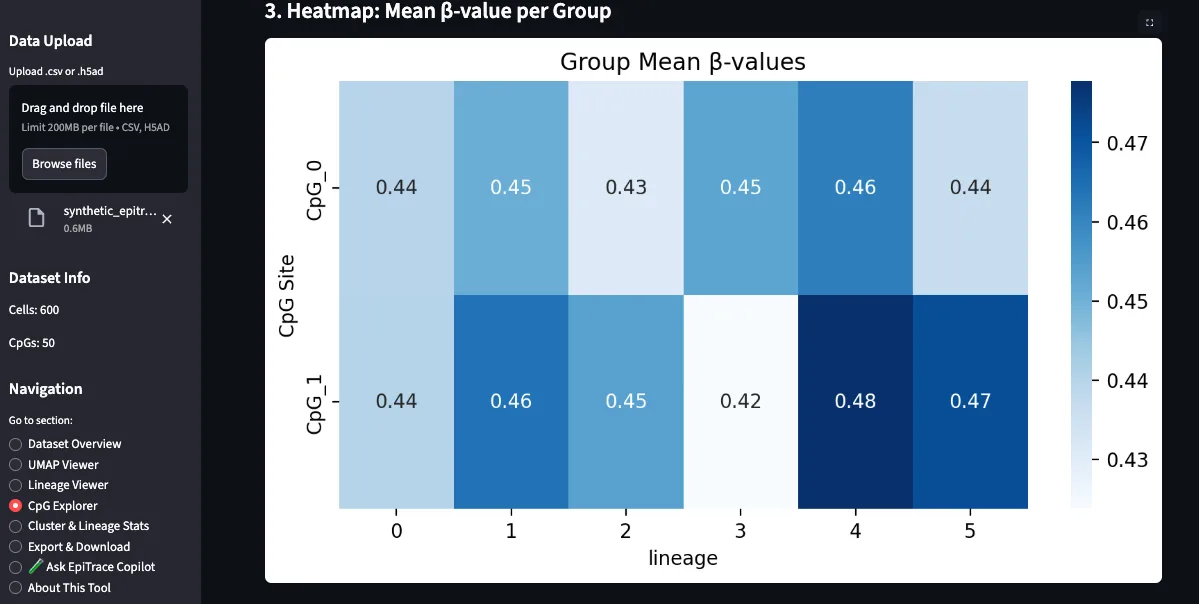
Violin plots and heat maps compare methylation at selected CpG sites across clusters, lineages or cell types.

  • Violin plots of methylation per group
  • Heat map of group means per CpG site
  • Colour scale from unmethylated to methylated
CpG explorer: Screenshot · platform v9.4.3 · synthetic demo data
Screenshot · platform v9.4.3 · synthetic demo data
05 / 07

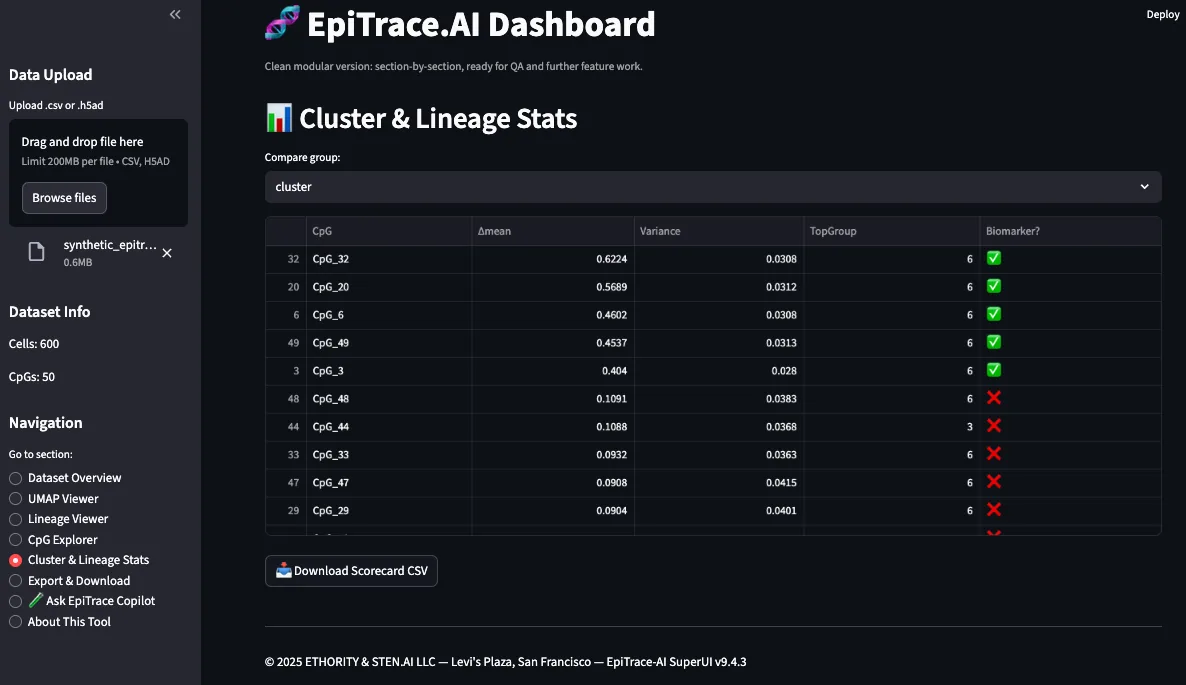
Marker scorecard

Which sites are candidate markers?

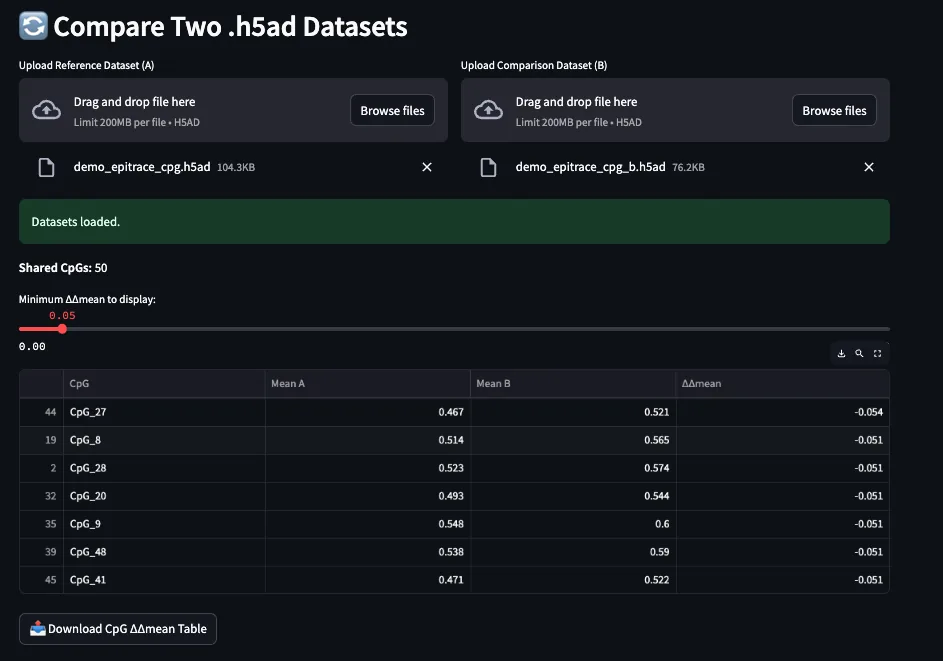
The scorecard ranks CpG sites by how clearly they separate groups and flags candidates for follow-up. A second view compares two data sets.

  • Gap between group means, spread within groups, variance per site
  • Candidate marker flag, sorting and filters
  • Comparison of two data sets with a difference table
Cluster and lineage scorecard: Screenshot · platform v9.4.3 · synthetic demo data
Screenshot · platform v9.4.3 · synthetic demo data
06 / 07

Export centre

How do results leave the platform?

Tables, figures and filtered cell lists go out as CSV and image files for papers, slides and further analysis.

  • Figures: UMAP maps, family trees, violin plots, heat maps
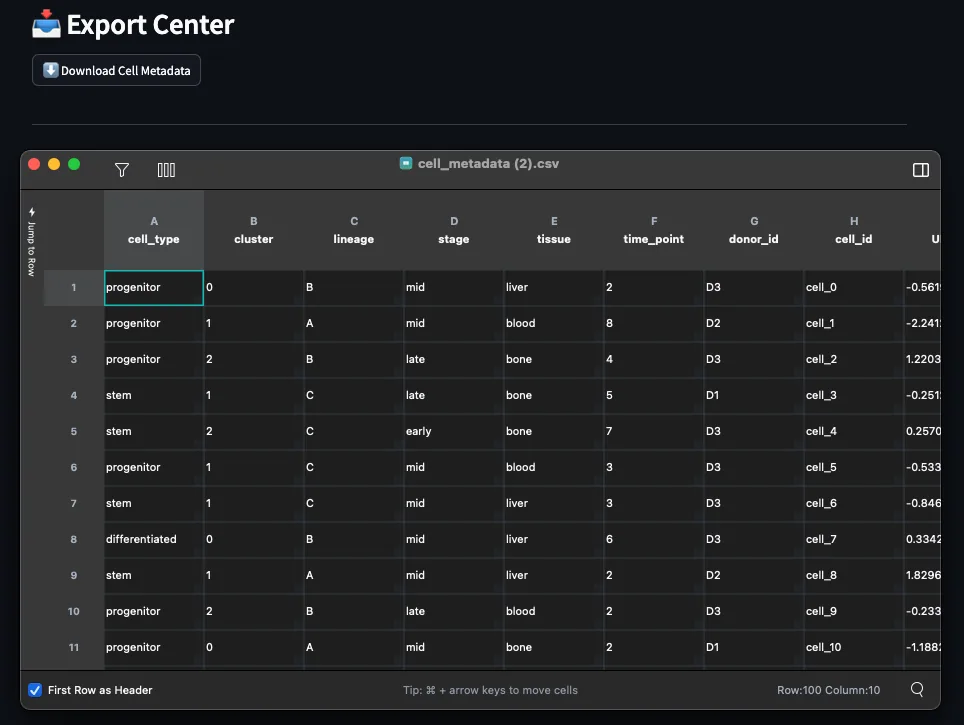
  • Tables: scorecards, filtered cells, metadata
  • Choice of format and resolution
Export centre: Screenshot · platform v9.4.3 · synthetic demo data
Screenshot · platform v9.4.3 · synthetic demo data
07 / 07

Copilot

Can I ask in plain language?

The copilot is an assistant inside the platform. Ask about the data or a view in plain language, and it points you to the relevant views and CpG sites. Version v2X extends it.

  • Questions in plain language
  • Points to the relevant views and CpG sites
  • Extended in version v2X
QuestionWhich CpG sites separate stem cells from differentiated cells?
  1. 1Opens the marker scorecard grouped by cell type
  2. 2Sorts sites by the gap between group means
  3. 3Shows the top sites in the CpG explorer

How a question becomes views · schematic

Data

Data in, results out

EpiTrace.AI reads the formats that single-cell research already uses. Methylation is stored per cell and CpG site as a value between 0 (unmethylated) and 1 (methylated).

DirectionFormatContent
In.h5ad (AnnData)Matrix of cells × CpG sites with methylation values; annotations per cell in obs
InCSVOne row per cell, one column per CpG site, plus annotation columns
OutCSVScorecards, filtered cell lists, metadata, comparison tables
OutPNG · SVGUMAP maps, family trees, violin plots and heat maps
# demo_epitrace_cpg.h5ad
AnnData · 100 cells × 50 CpG sites
X    methylation 0 … 1
obs  cell_type   stem · progenitor · differentiated
     lineage     A · B · C
     stage       early · mid · late
     tissue      blood · bone · liver
     donor_id    D1 · D2 · D3
     time_point  1 … 9
     cluster     0 … 3
var  CpG_0 … CpG_49

Structure of the demo file that ships with the platform

Operations

How it runs

ETHORITY operates EpiTrace.AI as a managed web application. Researchers need only a browser.

Researcher's browserHTTPSLogin · invitation listin preparationGoogle Cloud · Ubuntu LTS · systemdEpiTrace.AI applicationPython · StreamlitAnalysis corescanpy · anndataViewsPlotly · pyvisData sets.h5ad · CSVMonitoringSnapshotsNumPy · pandas · Plotly · pyvis
Architecture of platform v9.4.3
  • Encrypted connectionsAll pages and the application use HTTPS.
  • Access by invitationLogin with an invitation list for the pilot, in preparation.
  • BackupsSnapshots and deletion protection for the server.
  • MonitoringExternal availability checks around the clock.
  • EU region for personal dataPersonal or sensitive data is processed in the EU region Frankfurt.
Method

Method basis

Methodically, EpiTrace.AI builds on the methVAE approach, a variational autoencoder for single-cell methylation data. The platform makes such methods usable through one interface, shared filters and exports, so that research groups spend their time on questions rather than on tooling.

Next version

EpiTrace.AI v2X: more data layers, clearer reasons

Version v2X is in planning for 2027. It keeps the seven modules and adds four capabilities. All four are research tools: they produce hypotheses that researchers test in the lab.

In planning

Deeper models

A transformer-based variational autoencoder, a model that condenses each cell into a few meaningful numbers, extends today's methVAE approach to longer patterns across many CpG sites and to lineages reconstructed directly from inherited methylation changes.

In planning

Reasons next to results

Methods of explainable AI such as SHAP values and attention maps show which CpG sites carry a result.

In planning

More data on one map

Further layers join the methylation map: gene activity (RNA-seq), open chromatin (ATAC-seq), protein binding (ChIP-seq) and the position of cells in tissue (spatial data).

In planning

Likely next states

Models estimate where a cell is likely to develop next. Researchers use these estimates to choose which experiments to run.

Roadmap

From now to 2027

  1. New website in English and German; app access with login; platform in the EU region Frankfurt; project room for the research project.

  2. Research project: roles, data rules and funding application; technical report with DOI.

  3. Next project phase starts; detailed planning of v2X with transformer models, explainable AI and further data layers.

  4. First joint results with partners; the platform as a service for further research groups.

Plan as of November 2026

Help turn the pilot into a research project

EpiTrace.AI is looking for research groups, funders and companies who want to take part. Each path starts with a short conversation with Sten Franke.